Binomial: software for the binomial probability distribution
- Draw a diagram for the binomial probability distribution or the cumulative distribution. Compute both distributions for a given number k of successes. Change the sample size n and probability p of success. Save the diagram as *.png.
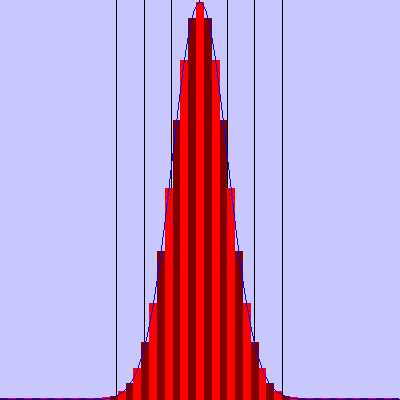
- Illustrate σ-neighborhoods by lines (gray) and by displaying k and z. Rescale the diagram such that its convergence is apparent as n → ∞. Draw the corresponding curve of the Gaussian normal distribution (blue).
- Compute confidence intervals or intervals of rejection for a given level of significance α.
- Exercise sheets with explanations and exercises are integrated into the program, at present only for the German version. They are reproduced here.
Download (5.0 MB).
Integrated explanations and exercise sheets are reproduced on the German page.